Appendix II
Gaussian Integration
Gaussian integration as applied in WOFOST/CGMS, is based on a study by Goudriaan (1986). Crop photosynthesis rate can be computed from the photosynthesis - light response curve of individual leaves, incoming radiation and leaf area index. Leaf area distribution, extinction and reflection coefficients must also be known since they influence the distribution of the available radiation. This computational problem was essentially solved by De Wit (1965). He applied a stratification of leaf canopy, calculated absorbed radiation and corresponding photosynthesis rates of sunlit and shaded leaves in each layer. Contributions of the individual layers were added to find the crop photosynthesis rate. This procedure was repeated every 15 minutes to obtain the daily total of crop photosynthesis. This procedure is lucid and flexible, but rather time consuming and its use during an entire season as one would want in crop growth simulation, might become problematic.
For application in such models Goudriaan and Van Laar (1978) developed a summary model to calculate the daily total crop photosynthesis, based on a semi-empirical equation, fitted to computer output of the detailed model.
Usually integration in time or in spatial dimension is done with the well-known numerical methods such as Eulerian (rectangular), Simpson or Runga - Kuta methods. These methods are excellent and generally applicable because they permit feedback of the integrated value (state variable) on the rate itself. However, when there is no such feedback, and the profile of the rate is known on forehand, a method, devised by the German mathematician Gauss, is much more efficient and accurate.
Several examples of processes where this feedback is absent can be defined in the crop growth modeling. In those cases the Gaussian integration can be applied. Examples in WOFOST/CGMS where this method is used:
- calculation of crop photosynthesis from a known light profile. Integration of the light response curve over the leaf area at a given depth in the canopy.
- integrate an independently given diurnal course (for example assimilation) into a daily total.
In a more formal analysis the integration interval is normalized to unity, and centralized between x=-½ and x=½. The polynomial given by y=a+bx+cx2+dx3 ... will have value a at the center point x=0. Therefore, the integrated value obtained by the one point Gaussian integration, will also be equal to a. Analytical integration of the polynomial term by term shows that the integrals of all odd terms disappear around x=0, That means that the one-point method not only exactly integrates y=a, but also y=a+bx. Similarly the two-point method will exactly integrate y=a+bx+cx2 and y=a+bx+cx2+dx3. The next step is the three point method which will enable exact integration of the fourth order term (and automatically the fifth as well).
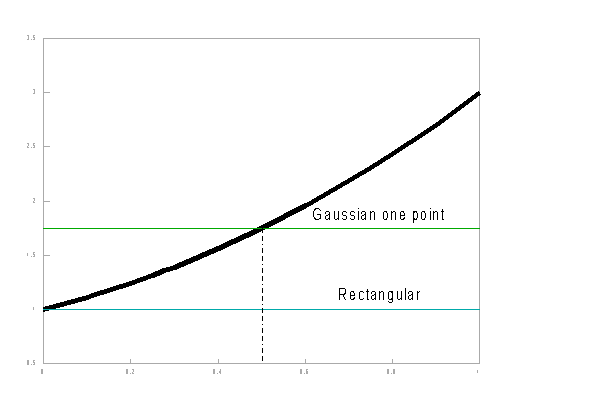
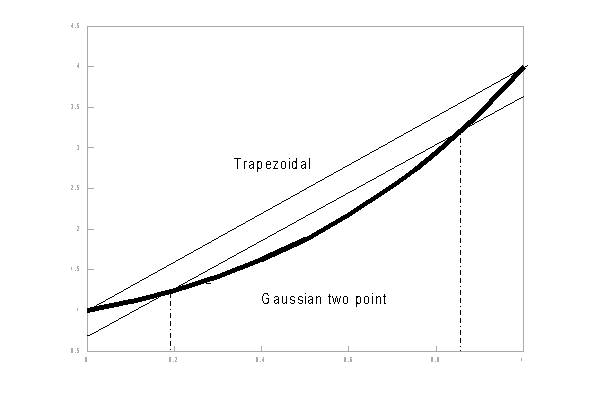
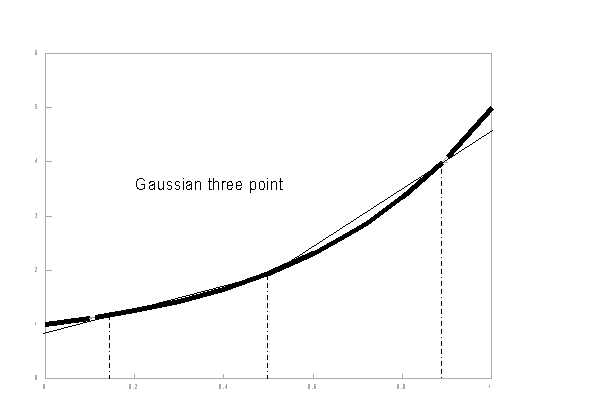
The three points of the Gaussian numerical integration are situated symmetrical around x = 0, in order to integrate the interval [-0.5,0.5]. Therefore, one of the three function evaluation points will be at the center, x=0. The other two points will be located at either side of the Y-axis at distance g (so x=-g and x=g). Now the interval [-0.5 ,0.5] is divided in three parts, around these three points. The lengths of these sub-intervals determine the weights which must be imposed on the Y-values corresponding to these three x-values and considered representative for their sub-interval. Because of the symmetry again, the weights belonging to -g and g are equal. When these weights are considered 1, the weight of the central sub-interval is equal to w.
The values of the relative distance g
and of the weight w can be derived
from the requirement that both the second and the fourth order
terms of the polynomial will be exactly integrated (Goudriaan,
1986):
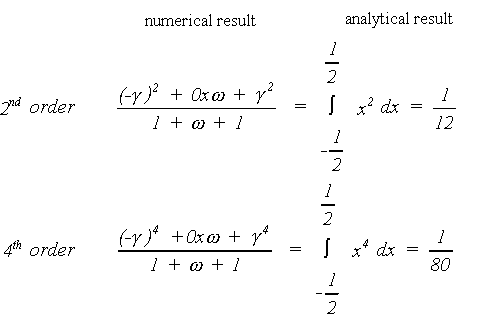
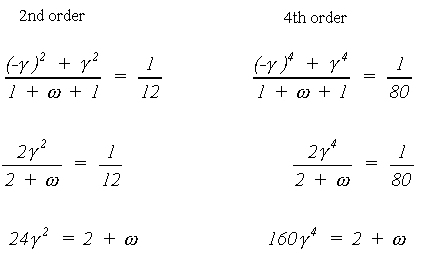
Substitution yields the following values for the relative distance and the weight:

hosted by Sudus Internet | powered by cmsGear
copyright 2026 Supit.net